
Statistical Propagation Modeling for Cellular Systems by Logan Scott
This page is best viewed with Microsoft Explorer. Netscape doesn't do greek or special characters.
For ground mobile systems, median path loss between
a transmitter and a receiver is usually, but not always, much higher than
predicted by free space propagation laws. Various measurement based empirical
laws have been developed to estimate median path loss for moderate to large
macrocells based on frequency, building environment, and antenna heights;
most notably the Hata2 and JTC3 models. These models
boil down to describing median path loss as:
Median Path Loss (dB) = A + B log10( R )
where:
A is median path loss in dB at 1km
B is the rate at which median signal strength falls off (10 times ")
R is range in
km
Free space A&B values at 1900 MHz are A=98 dB
and B=20 consistent with an R2 signal strength fall-off rate.
In dense residential areas with a 100' basestation antenna height, JTC models
indicate A&B values of A=132 dB and B=38 for an R3.8
signal strength fall-off rate. For further discussion on why signal strength
tends to fall off at an ~R4 rate see my page on Free Space Propagation and the Two Ray Model.
At the very short ranges characteristic of microcellular
deployments, typically less than 1 km, there is a large body of evidence4
that signal strength falls off more slowly consistent with line-of-sight
and/or ducting phenomenon. Fall-off rates revert to R2 and slower
at short ranges. With low basestation antenna heights in the "up to 40 foot
AGL" range, propagation is often nearly free space out to almost a kilometer
and then it starts to fall off very rapidly on the order of R66R9.
Variability is high. This will have profound implications for microcellular
deployments since classic engineered frequency reuse patterns and techniques
are not viable. Dynamic Channel Allocation (DCA) techniques are prevalent
in extant microcellular systems.
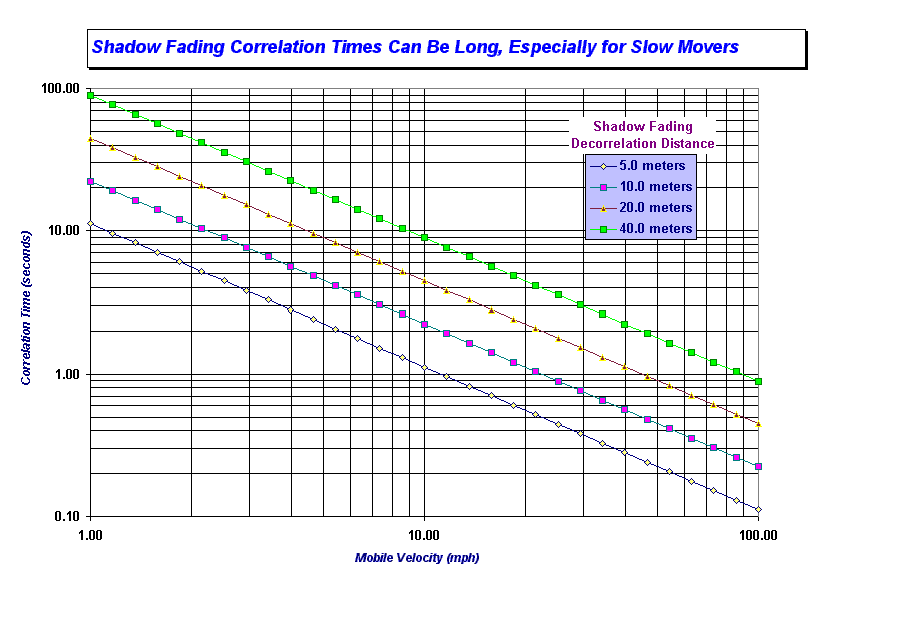
Two distinct types of fading generally need to be considered in engineering ground mobile systems; multipath fading and shadow fading. Field measurements have shown that large scale shadow fading due to buildings, terrain variations etc. tends to be log-normally distributed about the median signal strength. By this, we mean that the random component of path-loss is expressed in units of dB with a normal (Gaussian) distribution centered on the median path-loss. For example, with a Flog_normal = 10 dB, signal strength will be within "10 dB of the median 68% of the time ("1F) and within "20 dB of the median 95% of the time ("2F) . Typically, outdoor Flog_normal values in cellular bands are between 6 and 12 dB. Correlation distances associated with shadow fading are of the same order as the size of the objects causing the obtenebration, ~5 to 40 meters. As a consequence, shadow fading tends to change slowly, especially for slow moving users as is shown in Figure 1a.
Figure 1a: Shadow Fading Decorrelation Times as a Function of Velocity
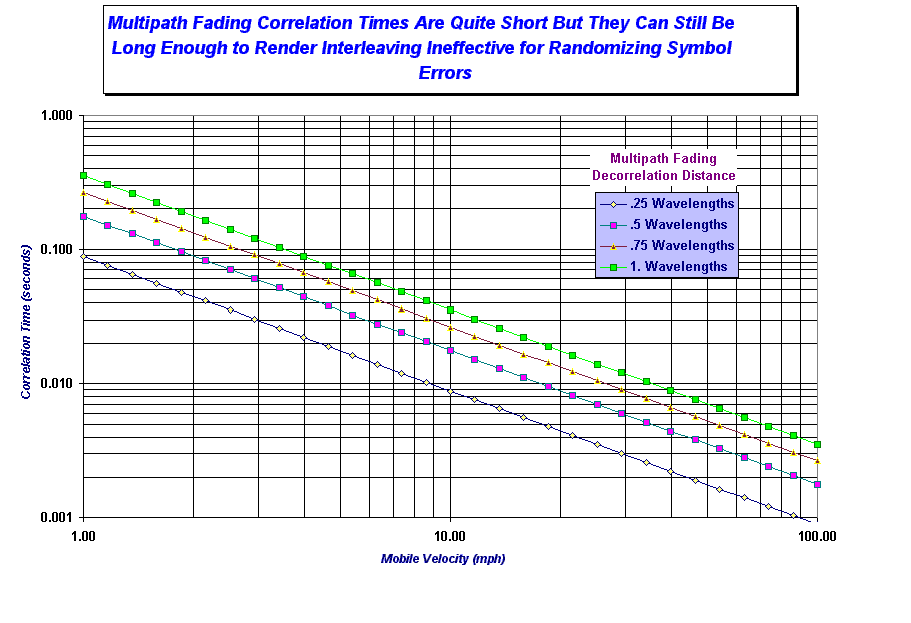
Multipath fading, sometimes called small scale fading is caused by the summation of various delayed and attenuated replicas of signal at the receiving antenna. Because of phase shifts, replicas may either tend to reinforce or cancel each other. Moving the mobile receiving antenna on the order of 28 (~6" @ 1900 MHz) largely decorrelates the fading experienced5 so as a consequence, multipath fading tends to decorrelate rapidly as is shown in Figure 1b. Amplitude statistics of narrowband signals in multipath fading are often characterized as Ricean with the degenerate case of Raleigh fading in diffuse reflection environments.
In some systems, Error Detecting And Correcting (EDAC) codes are combined with symbol interleaving to randomize symbol errors. Unless the interleaver span is longer than the decorrelation interval these techniques are largely ineffective in and of themselves. For voice communications, interleaver spans are limited to about 150 msec or less; otherwise unacceptable delays occur. Thus we see that EDAC techniques need to be augmented with other techniques such as antenna diversity, frequency hopping, and power control in order to maintain communications in a slow fading environment.
Figure 1b: Multipath Fading Decorrelation Times as a Function of Velocity (1900 MHz Center Frequency)
For wider bandwidth signals, multipath fading is broadly divided into two categories; flat and frequency selective fading. If delay spread between relatively strong replicas is much more than roughly 1/[2B Signal Bandwidth], the channel will be frequency selective with some frequency components of the signal attenuated more than others. Frequency Hopping systems take advantage of this fact to randomize symbol errors by hopping among several frequencies. If the delay spread is sufficiently small, all signal components tend to fade together and we must rely on antenna diversity or long interleaver spans to overcome deep fades.
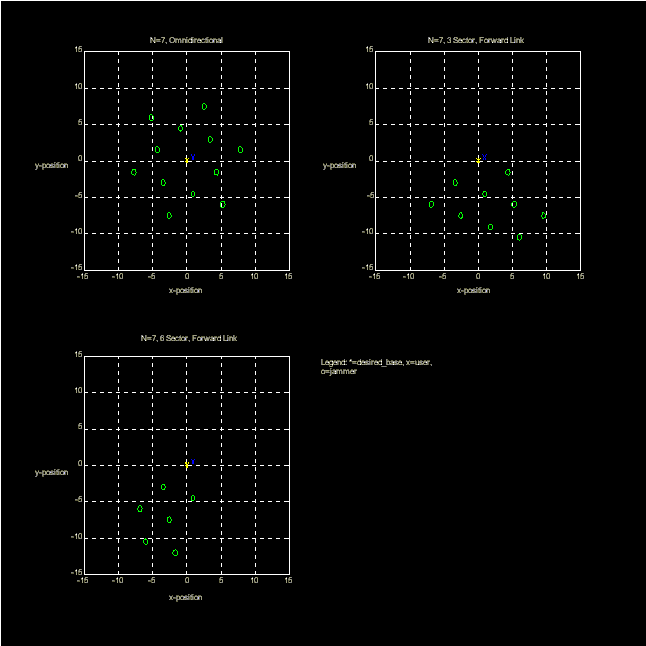
In cellular communications systems, frequencies are used again at sites sufficiently separated in distance in order to conserve spectrum. An air interface's tolerance to interference from distant sites is a key factor limiting how often a frequency can be reused. Sectorization also plays a role in that it limits the number of close interfering sources through the use of directional antennae. Figure 2 shows near in interference source geometry for an N=7 frequency reuse deployment on the forward link (base to mobile). In the case of omnidirectional basestations, the mobile unit (blue x) trying to hear the desired basestation (yellow *) can potentially receive interference from any cochannel basestation (green o). With a three sector deployment, basestations transmit over a 120o azimuth sector. Only the basestations transmitting in the direction of the mobile represent significant interference potential. In a six sector deployment, there are even fewer potential interfering sources.
Figure 2: Forward Link Interference Geometry for N=7
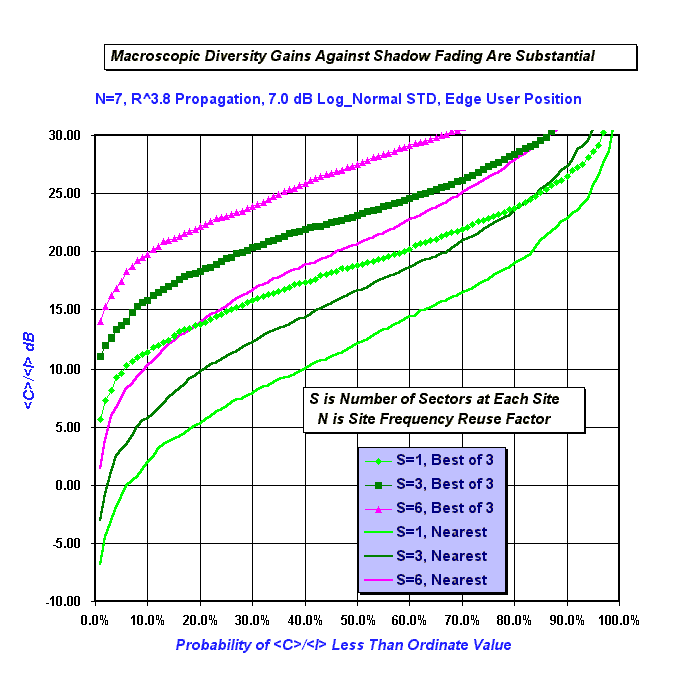
Based on Monte Carlo simulation, Figure 3 plots average signal to average interference ratio (<C>/<I>) on the forward link (base to mobile) as a function of likelihood for N=7 site frequency reuse. Median path losses for each individual Tx to Rx path are independently perturbed by log-normal shadow fading as generated by a Gaussian random number generator. Results from 1000 simulated cases are then sorted to obtain the results of Figure 3.
Here, median path loss is characterized by rate R3.8 signal power fall-off consistent with the JTC dense residential model and shadow fading STandard Deviation (STD) is a modest Flog_normal = 7 dB. The "x-axis" shows the percentage of simulated cases where the <C>/<I> was less than the indicated value. As an example, if we consider the S=1 (Omnidirectional basestation antenna) case and look only at the nearest basestation on frequency_1, there is a 50% probability that <C>/<I> will be less than 12 dB and a 10% probability that <C>/<I> is less than 2 dB.
If rapid handoff capabilities and/or soft handoff are incorporated into the air interface; significant gains <C>/<I> are attainable by picking the basestation with the best <C>/<I> at any given time. If the mobile unit scans around in frequency and looks at frequency_2 and frequency_3, the frequencies of it's next nearest neighbors, it might find a better <C>/<I>. This case is depicted in the S=1, "Best of 3" curve where in simulation, whichever basestation selection leads to the highest <C>/<I>, that one is selected. Now, there is a 10% chance that <C>/<I> will be +12 dB or less. Stated another way, there is a 90% chance that <C>/<I> is greater than +12 dB. Providing, the mobile is always locked onto the "Best of 3" it will obtain 10 dB of macroscopic diversity gain at the 90% confidence point. This is significant in that high confidence of sufficient <C>/<I> is needed to ensure reliable communications.
Figure 3: Forward Link <C>/<I> for N=7
Depending on specific modulation formats and error correction coding, different air interfaces tolerate varying levels of <C>/<I>. As an example, the American Mobile Phone Standard (AMPS) system is based on an analog 30 kHz wide narrowband FM modulation format and typically requires an average SNR of 15 dB or better to obtain clear reception. AMPS normally requires N=12 if sectorization is not used and N=7 with three sector deployments. Qualcomm's IS-95 CDMA system can operate with much lower average SNR's (~ -15 dB) because it uses relatively large bandwidths (1.25 MHz) to send data at low rates (~2.4 to 9.6 kbps). The attendant processing gain helps overcome the effects of noise and cochannel interference. As a consequence, N=1 frequency reuse is the norm for IS-95. The GSM system combines slow frequency hopping (217 hops/second) with ~rate 1/2 convolutional coding to operate acceptably with an average SNR of 9 dB. When using omnidirectional antennas, GSM requires N=7 frequency reuse to obtain good coverage. With three way sectorization, N=4 frequency reuse is commonly used.
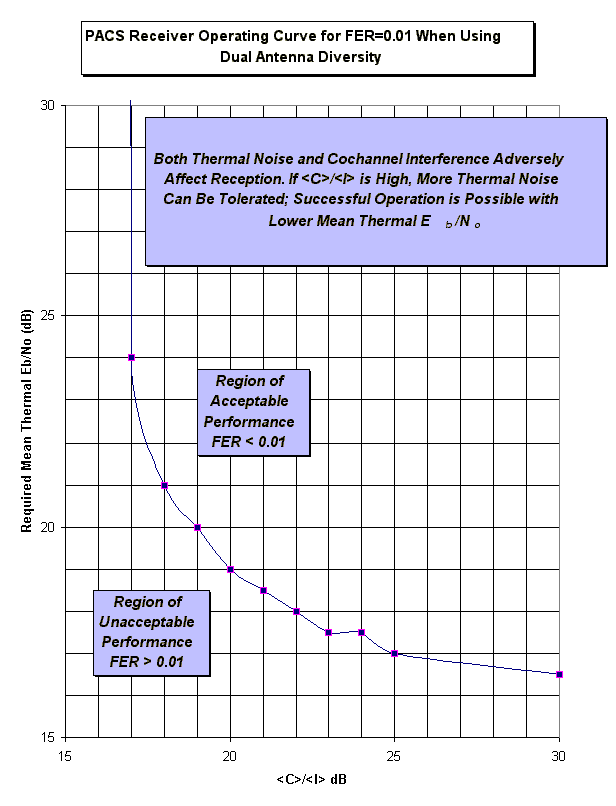
Personal Access Communications System (PACS)6 is a low tier air interface intended primarily for pedestrian users. Obtained through Monte Carlo simulation, Figure 4 plots a receiver operating characteristic for a PACS mobile receiver using two antenna diversity reception. As <C>/<I> decreases, the receiver sees more cochannel interference and becomes less tolerant of thermal noise. Figure 4 plots the dividing line between being able to obtain a Frame Error Rate (FER) of 0.01 and not being able to do so. The choice of FER = 0.01 is consistent with good voice quality when using a low rate (~8 kbps) vocoder. The PACS air interface makes provisions for future use of low rate vocoders but in current practice, the PACS system uses 32 kbps ADPCM (CCITT G.726). Somewhat higher FER could be tolerated.
Figure 4: PACS Receiver Operating Characteristic for FER = 0.01
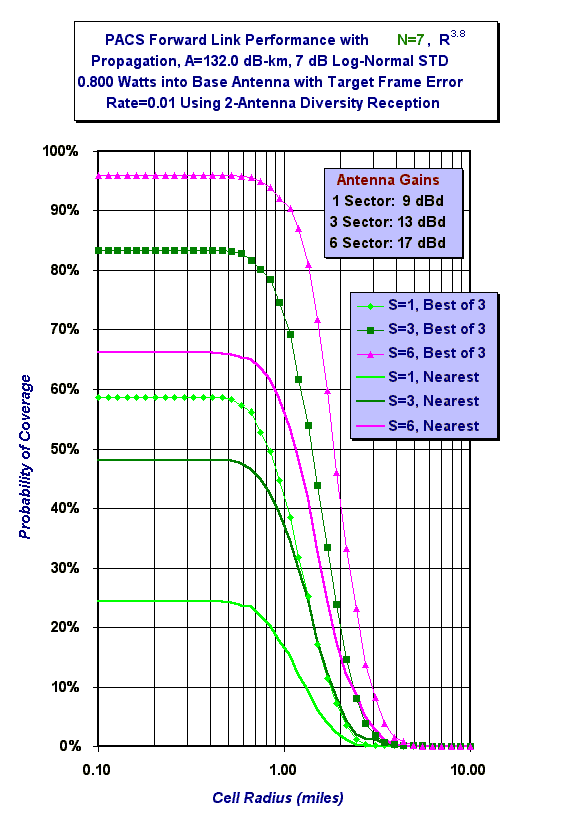
Using the <C>/<I> simulator of the previous section and extending it to compute mean thermal Eb/No as a function of range, we can simulate 1000 cases at each range and classify each case as "FER Acceptable" or "FER Unacceptable". Figure 5 which plots probability of obtaining required Frame Error Rate (FER) performance as a function of cell radius for N=7 frequency reuse. In this deployment model, basestations would be placed two times the cell radius apart. The mobile receiver employs dual antenna diversity to combat small scale fading and is required to provide a FER of 10-2 or better. Flat fading and static frequency allocations7 are assumed. The user is located near the cell edge. Providing the mobile unit moves at pedestrian velocities, the PACS air interface will handoff between basestations rapidly enough to obtain "Best of 3" performance. At higher speeds, the air interface is unable to keep up with the changing shadow environment and performance would be better described by the "Nearest" cases.
For deployments with closely packed cells we see coverage probability saturates because of <C>/<I>. Even though the desired signal is strong, in a significant proportion of locations, cochannel interference from other basestations is strong enough to jam out the desired signal even though mean thermal Eb/No is quite high. With S=1, coverage saturates at 58% for "Best of 3" operation. This means that 42% of all edge locations cannot provide FER of 0.01 or better.
As cells are less densely packed we start to see coverage probabilities start drop because of problems with signal strength. Mean thermal Eb/No falls with distance. Looking at specific cases, coverage probabilities with an N=7 frequency reuse are generally not capable of supporting FER < 0.01 except for the sectorized deployments more typical of high tier systems.
Figure 5: PACS Forward Link Coverage with FER = 0.01 for N=7
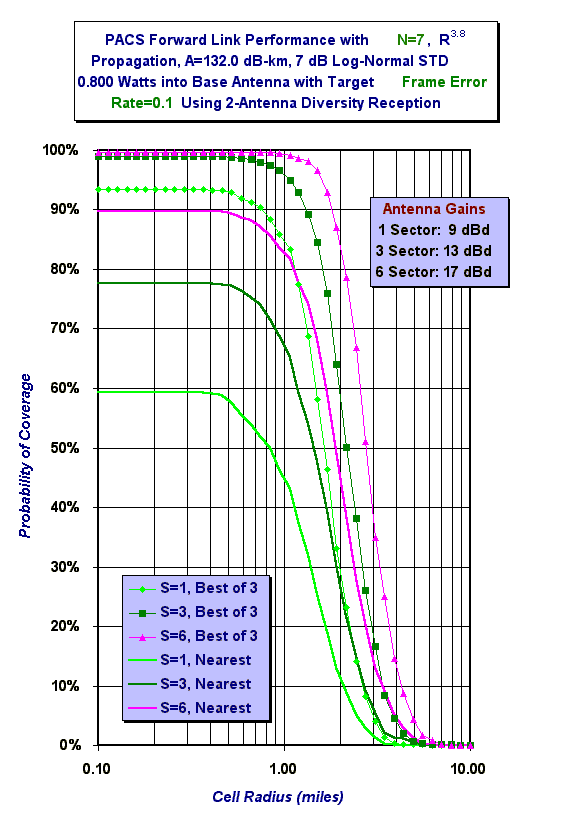
If a FER of 0.1 is acceptable, we obtain the results of Figure 6. In general, the apparent coverage is better with higher saturation coverage probabilities. At a FER of 10%, voice will be pretty scratchy with ADPCM and unusable with low rate vocoders.
Figure 6: PACS Forward Link Coverage with FER = 0.1 for N=7
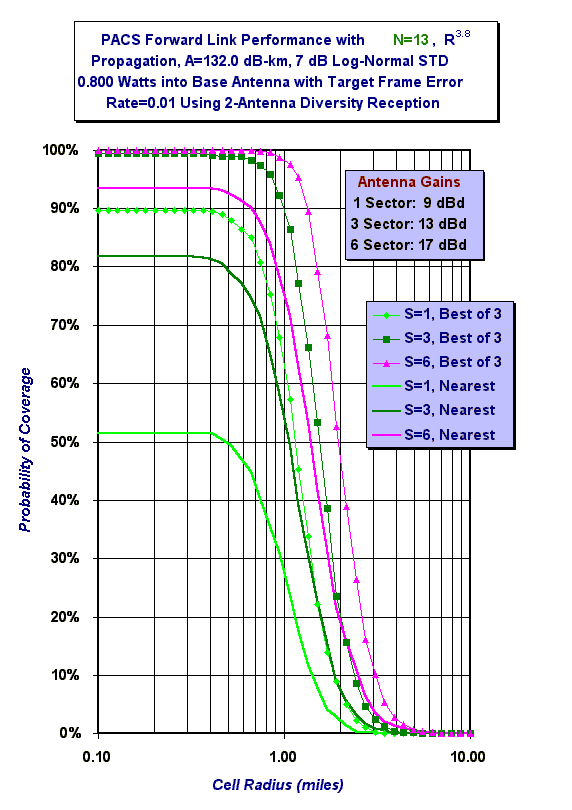
If we want good coverage at FER=0.01, we might want to reuse frequencies less often to improve <C>/<I>. Figure 7 considers an N=13 frequency reuse with static allocations. Now performance is generally quite acceptable providing user velocities are slow enough so "Best of 3" performance is obtained.
Figure 7: PACS Forward Link Coverage with FER = 0.01 for N=13
[1] For a more complete introduction, I suggest:
[2] M. Hata, Empirical Formula for Propagation Loss in Land Mobile Radio Services, IEEE Transactions on Vehicular Technology, August 1980
[3] JTC(AIR)/94.09.19-065R5 (there are probably more recent versions)
[4] The TTL Experimental License Progress Report for August 1991 reports on an extensive measurement program using low basestation antenna heights. It is just one of many sources on microcellular propagation.
[5] Basestation antennae on moderate to high towers are another story. Fade decorrelation distances are from 3 to 6 feet depending on tower height and frequency. See W.Y. Lee, "Mobile Communications Engineering", McGraw-Hill 1982, ISBN 0-07-037039-7. Also section 4.0 of this document.
[6] PACS originated within BELLCORE and has been standardized by T1 and TIA
[7] PACS includes provisions for a slow dynamic
channel allocation method on the forward link. Called QSAFA (Quasi Static
Automatic Frequency Allocation), this method may improve frequency reuse
performance.
For more information on
how I can help you with your system, contact me via my homepage or via e-mail at ![]()
This page created 3 October 1997, revised 7 October 1997, all rights reserved to Logan Scott, copyright 1997